Vanishing Ice:
All Natural!

Vanishing Ice:
All Natural!
|
Why Vanishing Ice Is Likely All Natural? (transcript and citations based on video)
If we are to truly prepare for the dangers of climate change and build more resilient environments, we must first understand natural climate change. Unfortunately due to the narrow focus on rising CO2, the public remains ill-informed and fearful about the causes retreating ice. Africa’s Mount Kilimanjaro and America’s Glacier National Park are 2 iconic examples of failed climate interpretations. For example, Al Gore’s “Inconvenient Truth” suggested warmth from rising CO2 had been melting Kilmanjaro’s glaciers. In truth, instrumental data revealed local temperatures have never risen above the freezing point. In 2004, Dr. Geoff Jenkins, Head of the Climate Prediction Programme at England’s Hadley Centre, was prompted by the evidence of no warming, to email the IPCC’s Phil Jones and ask and I quote “would you agree that there is no convincing evidence for Kilimanjaro glacier melt being due to recent warming (let alone man-made warming)?” Yet due to the politicization of climate science, Al Gore shared the Nobel Prize despite perpetuating the global warming myth of Kilimanjaro. Glacier experts from the University of Innsbruk published and I quote, “The near extinction of the plateau ice in modern times is controlled by the absence of sustained regional wet periods rather than changes in local air temperature on the peak of Kilimanjaro.” Changing patterns of precipitation were recorded in the water level of nearby Lake Naivasha. As researchers documented in this graph, the region had experienced increasing precipitation during the Little Ice Age, followed by a sharp drying trend that began in the late 1700s, which triggered Kilimanjaro’s retreat long before CO2 ever reached significant concentrations. 7,8 Ice structures such as these penitentes, are commonly seen in many high elevation glaciers, and help scientists determine if retreating ice was caused by below freezing sublimation, or melting from warmer air. Over decades, sublimation creates sharp features at the border between sunlight and shade. In contrast, any melting from warm air temperatures oozes across the icy surface destroying those sharp features in a matter of days. So the presence of sharp-angled features like these penitentes, are excellent long term indicators of dry and below freezing temperatures.
Over 30 years ago I visited Glacier National Park, home of the 2nd iconic example of misrepresented glacier retreat. After thousands of years with less ice, the park’s glaciers grew to their maximum extent during the Little Ice Age. Then they began retreating around 1850. Although the media now hypes the park’s disappearing glaciers as evidence of CO2 warming, the greatest retreats happened long before CO2 could exert any possible effect. In 1913 the park’s largest glacier, the Sperry Glacier was nearly 500 feet thick at a point that would soon become its 1946 terminal edge. By 1936 that thickness had dwindled by 80%. That rapid retreat prompted scientists 70 years ago to predict a natural disappearance of the park’s glaciers. 18,19 As seen here, the contrast between the early and late 20th century retreat is striking. Between 1913 and 1945 the rate of retreat for the Sperry glacier was 10 times faster [due to drought] than rate of retreat since 1979. If rising CO2 has been the driver of recent melting, we would expect an increasingly faster rate of retreat, not slower! If we are to prepare for changes caused by melting ice, we must view our vanishing ice from a perspective of centuries and millennia, and tht perspective insists that we understand natural climate change.18
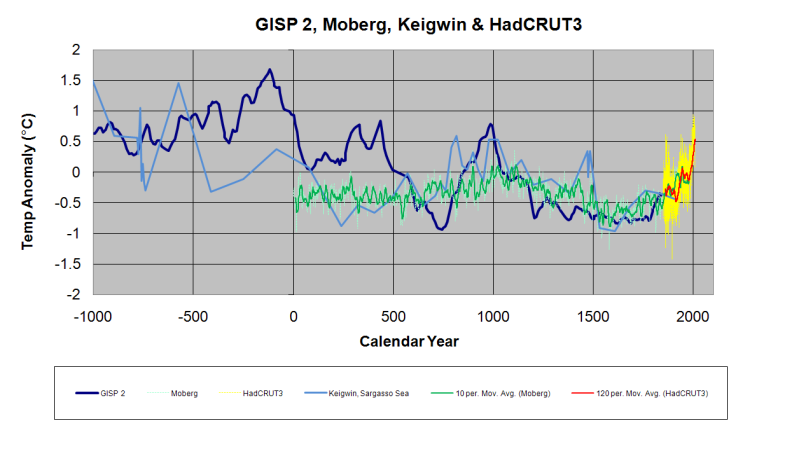
There is an abundance of evidence demonstrating that relative to today, far less ice covered the globe during the last 10,000 years, a period known as the Holocene.[i.e. here and here) Far less ice despite much lower CO2 concentrations.2, 10, 11 Likewise, although most of today’s average global temperature has been driven by heat ventilating from the Arctic Ocean, as visualized in this NASA graphic, Arctic temperatures were also far warmer during most of the Holocene. Based on changes in tree line, pollen samples and ocean sediments, scientists estimate Arctic air temperatures during the mid Holocene averaged 2 to 7°C higher than today. 3,57,58 This ice core data from Greenland, exemplifies the Holocene’s changing temperature patterns common for most of the Arctic. But it is a pattern that also corresponds to climate change in many other regions across the globe. After the last Ice Age ended, the period of warmer temperatures between 9,000 and 4,000 years ago has been dubbed the Holocene Optimum. During that time, remnant glaciers from the Ice Age retreated and shrank to sizes far smaller than we witness today. All of Norway’s glaciers completely disappeared at least once,11,39 and Greenland’s greatest glaciers, like the Jakobshavn, remained much further inland than now observed.29 Like many northern glaciers, Jakobshavn had only recently advanced past its present terminus during the unprecedented cold of the Little Ice Age.
From whale bones,42 Arctic driftwood,26 and patterns of Arctic shoreline erosion,25 we also know that during the Holocene, Arctic summer sea ice retreated 1000 kilometers further north than seen today. Treelines advanced to their greatest northern limits,3 reaching Arctic Ocean shores 9000 years ago, hundreds of kilometers further north than their current limits.1 The paleo-eskimos, or Tuniit, colonized the Arctic’s shoreline about 5000 years ago. They hunted Musk Ox and Caribou with bow and arrow. They lived in tents and heated those tents with Wood. Archaeologists studying Tuniit colonization of Arctic shores, reported periodic abandonment and occupation that corresponded with periods when summer sea surface temperatures bounced between 2–4° cooler and 6°C Warmer than present. Likewise, concentrations of Arctic summer sea ice ranged from 2 months more sea ice to 4 months more open water.27 Changes in insolation due to the sun’s orbital cycles, or Milankovitch cycles, correspond with the recent 100,000-year cycles of past major ice ages. We are currently in another warm peak. The Milankovitch orbital cycles also predicted the current cooling trend that began about 4000 years ago. However warm spikes due to high solar output punctuated this cooling trend roughly every thousand years.22 The unprecedented Holocene glacier growth during the Little Ice Age occurred when solar output was extremely low. In this graph depicting 300+ years of solar flux, the earth warmed as we ascended from the Little Ice Age. Our recent warm spike coincides with high solar flux. However, recently solar output has again retreated, approaching Little Ice Age levels, and correlates with the increasing frequency of cold winters. The next two decades will allows us to evaluate more accurately the effect of these solar changes on climate and glaciers.
The correlation between Greenland ice core data and solar flux, is also seen in Scandinavian tree ring data.15 Tree rings suggest the warmest decade in the past 2000 years, happened during the warm spike of the Roman Warm Period between 27 and 56 AD. After a period of resumed cooling a new warm spike occurred 1000 years ago during the Medieval Warm Period. After more extreme cooling during the Little Ice Age, a third warm spike peaked around the 1940s. Most interesting, the consensus from multiple tree ring data sets around the world, also suggest natural habitats were warmer during the 1940s than they are now. Likewise, the greatest rates of retreat for glaciers from Glacier National Park to the European Alps also happened during the 1940s. The Great Aletsch, the largest and best studied of all the Swiss Alp’s glaciers beautifully illustrates the 3000-year cooling trend punctuated with periodic warm spikes that caused rapid glacier retreats. The Great Aletsch’s maximum length during the Holocene was also reached during the Little Ice age. About 1850 it began retreating to its current position, represented by this baseline.39 However during the warmth of the Bronze Age 3000 years ago, the glacier was Much smaller than today. During the cooler Iron Age the glacier began to grow, but rapidly retreated during the warm spike of the Roman Warm Period. The glacier advanced again almost reaching its Little Ice Age maximum, but retreated rapidly during the warm spike during the Medieval Warm Period.
During the Little Ice Age, the Great Aletsch advanced to its greatest length of the Holocene, in rhythm with a series of 4 documented solar minimums. Each advance was followed by a rapid retreat, similar to what we observe today, when solar flux increased. The glaciers recent retreat does not appear any different from retreats in past. So what does that tell us? To be clear the skeptic argument is not “because it was natural before then CO2 can not possibly contribute today”. The skeptic argument is simply, we can not determine the sensitivity of our climate and glaciers to rising CO2, until we have fully accounted for past and present natural dynamics. Far too often the media, and a few invested atmospheric scientists, simply assert that retreating glaciers were all natural in the past, but since 1950 the retreat is suddenly due to CO2. But past natural climate dynamics did not suddenly stop operating in 1950. To what degree are natural climate dynamics contributing today? Well, more recent patterns of advancing and retreating ice suggest natural dynamics are the main drivers of today’s retreating ice A century of mass change measurements for several Swiss glaciers allow us to more finely resolve changes between decades. Again the greatest rate of 20th century retreat occurred during the 1930 and 40s, and once again, before CO2 concentration had any significant impact. The rapid 1940s retreat is linked to unusually high solar insolation and patterns of precipitation governed by the Atlantic Multidecadal and North Atlantic Oscillation.42, 43
Furthermore when solar flux dipped between the 1960s and 80s, a high proportion of Alpine glaciers, as well as glaciers around the world, stopped retreating and many began to advance as seen here in the Alps. Changes in solar insolation affect oceans in two critical ways. During high solar output of the Medieval Warm Period, tropical waters in both the Atlantic13 and Pacific14 increased by as much as 1°C warmer than today. During the solar minimums of the Little Ice Age, tropical oceans dropped by as much as 1°C degree cooler than today. But equally important changes in insolation affected the volume of warmer tropical waters that were transported toward the poles. Multiple lines of evidence correlate higher solar activity during the Roman and Medieval Warm Periods, with an increased flow of warm Atlantic water into the Arctic,16 resulting in reduced sea ice. Conversely, during low solar activity during the Little Ice Age, transport of warm water was reduced by 10% and Arctic sea ice increased.17 Although it is not a situation I would ever hope for, if history repeats itself, then natural climate dynamics of the past suggest, the current drop in the sun’s output will produce a similar cooler climate, and it will likely be detected first as a slow down in the poleward transport of ocean heat.22 Should we prepare for this possibility? Water heated in the tropics is saltier and denser, and when transported into the Arctic lurks 100 to 900 meters below the surface.45 That warm subsurface water can melt sea ice and undermine grounding points of submerged glaciers causing an acceleration of ice discharge. Intruding warm deep water also melts the underside of floating ice shelves, which also accelerates calving and ice discharge. Instrumental records of Greenland’s air temperatures, also recorded the fastest rate of warming during the 1930s and 40s44 coinciding with increased inflows of warm Atlantic water.53,54,55,56 Accordingly intruding warm waters also transported more southerly fish species, prompting the birth of Greenland’s Cod fishery.59 CO2 driven models have completely failed to simulate this Arctic warming.60 Simultaneously the best studied Greenland glacier, the Jakobshavn, began retreating from its Little Ice Age maximum with it fastest observed retreat of 500 meters per year between 1929 and 1942. The rapid retreat was amplified when the glacier’s terminal front became ungrounded from the ridge. That earlier grounding point had previously prevented warm subsurface waters from entering its fjord. With more warm water entering the fjord, the grounding point rapidly retreated.9,11,30,31 When warm water intrusions subsided, the glacier stabilized, and even began advancing between 1985–2002. Although the recent retreat of Greenland’s glaciers is reported as an acceleration relative to the 70s, the rate of retreat is now much slower than the 30s and 40s. And again the 20th century pattern of retreat does not correlate with rising CO2 concentrations. The 20th century pattern of Greenland’s melting glaciers correlates best with the timing and distribution of intruding warm Atlantic water. As seen in these illustrations, due to changes in the North Atlantic Oscillation in the 1990s, a sudden influx of warm Atlantic water entered the Irminger Current. The numbers here indicate that the current’s temperature cooled from 10°C to 1.5 °C above freezing as it traveled along Greenland’s coast.10
As seen here from recent satellite estimates, the amount of Greenland’s lost continental ice, coincides with the warmth of the Irminger Current, with pinker areas representing the highest rates of lost ice.24
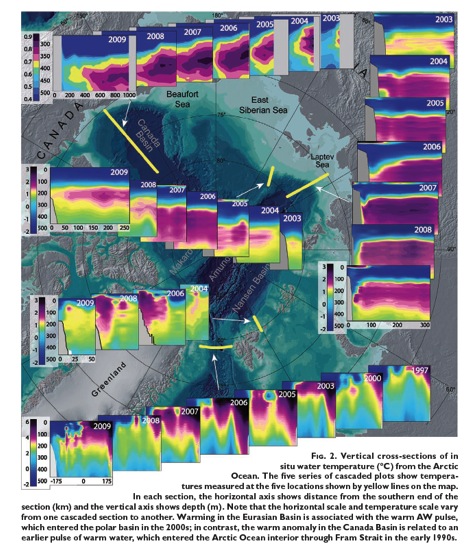
Warm Atlantic waters that don’t enter the Irminger Current, continue deeper into the Arctic, mostly via the Barents Sea. Greater volumes of intruding warm water cause greater reductions of ice in the Barents and Kara Seas, deep inside the Arctic Circle. Danish Sea Ice records reveal a similar loss of sea ice during the 1930s rivaling the recent decline. Coinciding with cycles of reduced sea ice, glaciers on the island Novaya Zemlya in the Barents Sea, also underwent their greatest retreat around 1920 to 1940.61 After several decades of stability, its tidewater glaciers began retreating again around the year 2000, but at a rate five times slower than the 1930s.47 The recent cycle of intruding warm Atlantic water45 is now waning and if solar flux remains low, we should expect Arctic sea ice in the Barents and Kara seas to begin a recovery and Arctic glaciers to stabilize within the next 15 years. The contrasting behavior of Antarctic Ice is further confirmation that intruding warm water is a natural driver of melting polar ice. Unlike ice that melted deep inside the Arctic Circle, Antarctic Sea Ice has increased to record extent and expands far outside the Antarctic Circle. Why such polar opposites? Because Antarctica is shielded from intruding warm waters by a Circumpolar Current. Antarctica’s Circumpolar Current consists of warm subtropical waters driven eastward by westerly winds. Because there are no continents to block its path or deflect those warm waters poleward, the Circumpolar Current simply encircles the continent. The one place where Antarctic sea ice has retreated slightly, only occurs along the western side of the Antarctic Peninsula where the Circumpolar Current makes its closest approach.31,46 Likewise without intruding warm waters, Antarctica has lost far less continental ice than Greenland. Although Antarctica contains 14 times more ice than Greenland, Greenland has lost between 2 and 5 times more ice than Antarctica.33,34 Based on changes in gravity, most areas of Antarctica have slightly gained ice designated by greenish tones.24 However where warm waters and winds of the Circumpolar current approach the Peninsula, there has been moderate ice loss designated by bluish tones. And despite being Antarctica’s most poleward coastline, there has been a great loss of glacier ice around the Amundsen Sea, illustrated by redder tones, causing a net loss of ice for the continent.48
The reason for this concentrated melting is due to the upwelling of relatively warm Circumpolar Deep Water that lurks 300 feet below the surface. Glaciers along the Amundsen Sea terminate in deep water, and are most susceptible to periodic upwelling of that warmer deep water, which causes basal melting.49,50,51,52 Maps pinpointing regions with the greatest basal melt,48 highlighted here by red dots, coincide with the greatest loss of glacier ice along the Amundsen Sea hot spot. Amundsen glaciers are grounded along the coastal shelf where ancient channels can direct warm, upwelled deep water directly to the base of the glaciers. Early explorers reported excessive crevasses and concave surfaces on these glaciers suggesting extreme basal melting was happening in 1950s, and was likely a process that has been ongoing on for millennia.38 Much like Greenland’s Jakobshavn glacier, once Amundsen’s glaciers retreated from their Highest ridge on the continental shelves, upwelled warm water could overflow the ridge and melt an increasingly larger cavity near the glaciers grounding points. In turn, a larger cavity allows even more warm water to enter. In contrast, the few Amundsen Sea glaciers with grounding points located beyond the reach of upwelled waters, those glaciers have not lost any ice. Like the rhythm of retreating and advancing glaciers, rates of sea level rise have ebbed and flowed as seen in this graph from the IPCC. Again it is the 30s and 40s that experienced both the greatest retreat of glaciers and the fastest rise in global sea level. With the recent decline in solar flux and the shift to cool phases of ocean oscillations, natural climate change suggests that although glacier retreat and sea level rise will likely continue over the next few decades, the rates of sea level rise and glacier retreats will slow down.The next decade will provide the natural experiment to test the validity of competing hypotheses. Are changes in the earth’s ice driven by natural or CO2 driven climate change. I am betting on natural climate change.
Read more about natural climate change In Landscapes and Cycles: An Environmentalist’s Journey to Climate Skeptisicsm!
Peer Reviewed Citations 1. MacDonald, G. (2000) Holocene Treeline History and Climate Change Across Northern Eurasia. Quaternary Research 53, 302–311 (2000) 2. Renssen, H. (2012) Global characterization of the Holocene Thermal Maximum. Quaternary Science Reviews 48 (2012) 7e19 3. MacDonald, G. (2008) Climate change and the northern Russian treeline zone. Phil. Trans. R. Soc. B, vol. 363, p. 2285-2299 4. Funder, S. (2011) A 10,000-Year Record of Arctic Ocean Sea-Ice Variability—View from the Beach. Science, vol 333 5. Fan, T., et al. (2014) Recent Antarctic sea ice trends in the context of Southern Ocean surface climate variations since 1950, Geophys. Res. Lett., 41, 2419–2426, doi:10.1002/2014GL059239 6. Pederson,G., et al., (2006) Long-Duration Drought Variability and Impacts on Ecosystem Services: A Case Study from Glacier National Park, Montana. . Earth Interactions, vol. 10, p.1?28 7. Kaser, G., et al. (2012) Is the decline of ice on Kilimanjaro unprecedented in the Holocene? The Holocene, doi:10.1177/0959683610369498. 8. Kaser, G., et al. (2006) Mass balance of glaciers and ice caps: Consensus estimates for 1961–2004. Geophysical Research Letters, vol. 33, L19501, doi:10.1029/2006GL027511 9. Lloyd, J. (2011) A 100 yr record of ocean temperature control on the stability of Jakobshavn Isbrae, West Greenland. Geology, v. 39; 10. Holland, D. et al. (2008) Acceleration of Jakobshavn Isbræ triggered by warm subsurface ocean waters. Nature Geoscience vol. 1 11. Young, N., et al., (2011) Response of Jakobshavn Isbræ, Greenland, to Holocene climate Change. Geology, vol. 39, p. 131?134. 12. Nesje, A., et al. (2007) Norwegian mountain glaciers in the past, present and future. Global and Planetary Change, vol. 60, p. 10–27. 13. Keigwin, L. The Little Ice Age and Medieval Warm Period in the Sargasso Sea. Science, vol. 274 14. Rosenthal, Y. et al. (2013) Pacific Ocean Heat Content During the Past 10,000 Years. Science, vol. 342 15. Esper, J. et al. (2012) Variability and extremes of northern Scandinavian summer temperatures over the past two millennia. Global and Planetary Change 88–89 (2012) 1–9. 16. Bianchi GG, McCave IN; McCave (February 1999), Holocene periodicity in North Atlantic climate and deep-ocean flow south of Iceland, Nature 397 (6719): 515–7, 17. Lund, D. (2006) Gulf Stream density structure and transport during the past millennium. Nature, vol. 444. 18. Dyson, J. (1948) Shrinkage of Sperry and Grinnell Glaciers, Glacier National Park, Montana. Geographical Review, vol. 38, pp. 95-103 19. Pederson,G., et al., (2006) Long-Duration Drought Variability and Impacts on Ecosystem Services: A Case Study from Glacier National Park, Montana. . Earth Interactions, vol. 10, p.1?28. 20. Long. W. (1953) Recession of Easton and Deming Glacier. The Scientific Monthly, Vol. 76, pp. 241-247. 21. Straeno et al (2012) Characteristics of ocean waters reaching Greenland’s glaciers. Annals of Glaciology 53(60) 22. Broecker, W.S., Denton, G.H., 2008. Wobbly ocean conveyor circulation during the Holocene? Quaternary Science Reviews 27, 1939–1950. 23. Howat, I., and Eddy, A., (2011) Multi-decadal retreat of Greenland’s marine-terminating glaciers. Journal of Glaciology, Vol. 57, p. 38?396. 24. Velicogna (2014) Regional acceleration in ice mass loss from Greenland and Antarctica using GRACE time-variable gravity data.† Geophysical Research Letters 25. Funder, S. et al. (2011) A 10,000-Year Record of Arctic Ocean Sea-Ice Variability—View from the Beach. Science vol. 333, p. 747?750 26. Häggblom, A. (1982) Driftwood in Svalbard as an Indicator of Sea Ice Geografiska Annaler. Series A, Physical Geography, Vol. 64, No. 1/2 (1982), 27. Mudie, P. (2005) Decadal-scale sea ice changes in the Canadian Arctic and their impacts on humans during the past 4,000 years. Environmental Archaeology, vol. 10, p. 113-126. 28. Nesje, A., and Dahl, S. (2003) The ‘Little Ice Age’ – only temperature? The Holocene, vol. 13, p. 139?145. 29. Nesje, A., et al. (2007) Norwegian mountain glaciers in the past, present and future. Global and Planetary Change, vol. 60, p. 10–27. 30. Young, N., et al., (2011) Response of Jakobshavn Isbræ, Greenland, to Holocene climate Change. Geology, vol. 39, p. 131?134. 31. Csatho, B., et al., (2008) Intermittent thinning of Jakobshavn Isbræ, West Greenland, since the Little Ice Age. Journal of Glaciology, vol. 54, p. 131?145. 32. Sicre, M. et al (2008) Decadal variability of sea surface temperatures off North Iceland over the last 2000 yrs. Earth and Planetary Science Letters 268 (2008) 137-142 33. Greenland Factsheet From Byrd Polar Research Center http://bprc.osu.edu/wiki/Greenland_Factsheet#Ice_Sheet_Volume 34. Quick Facts on Ice Sheets: national Snow and Ice Data Cener. http://nsidc.org/cryosphere/quickfacts/icesheets.html 35. Shepherd, A. et al (2012) A Reconciled Estimate of Ice-Sheet Mass Balance. Science, vol. 338 36. van den Broeke (2009) Partitioning Recent Greenland Mass Loss Science, vol. 326, 984-986 37. Loyd, J. et al (2011) A 100 yr record of ocean temperature control on the stability of Jakobshavn Isbrae, West Greenland. Geology, September 2011; v. 39; no. 9; p. 867–870 38. Hughes, T (1973) Is The west Antarctic Ice Sheet Disintegrating? Journal Of Geophysical, Research. vol. 78 39. Holzhauser, H., et al. (2005) Glacier and lake-level variations in west?central Europe over the last 3500 years. The Holocene, vol. 15, p. 789-801. 40. Nesje, A., and Dahl, S. (2003) The ‘Little Ice Age’ – only temperature? The Holocene, vol. 13, p. 139?145. 41. Savelle, J. et al. (2000) Holocene Bowhead Whale (Balaena mysticetus) Mortality Patterns in the Canadian Arctic Archipelago. ARCTIC, VOL. 53, p. 414–421. 42. Huss, M., et al., (2009) Strong Alpine glacier melt in the 1940s due to enhanced solar radiation. Geophysical Research Letters, vol. 36, p. 1-5. 43. Huss, M. et al., (2010) 100?year mass changes in the Swiss Alps linked to the Atlantic Multidecadal Oscillation. Geophysical Research Letters, vol. 37, p. 1-5. 44. Chylek, P., et al. (2006) Greenland warming of 1920–1930 and 1995–2005. Geophysical Research Letters, vol. 33, L11707, doi:10.1029/2006GL026510. 45. Polyakov, I., et al. (2011), Fate of early 2000s Arctic warm water pulse, Bull. Am. Meteorol. Soc., vol. 92, p. 561–566, doi:10.1175/2010BAMS2921.1. 46. Turner, J. et al (2009) Non-annular atmospheric circulation change induced by stratospheric ozone depletion and its role in the recent increase of Antarctic sea ice extent. GEOPHYSICAL RESEARCH LETTERS, VOL. 36, L08502, doi:10.1029/2009GL037524. 47. Carr, J. (2014) Recent retreat of major outlet glaciers on Novaya Zemlya, Russian Arctic, influenced by fjord geometry and sea-ice conditions Journal of Glaciology, Volume 60, pp. 155-170(16) 48. Depoorter. et al. (2013) Calving Fluxes And Basal Melt Rates Of Antarctic Ice Shelves. Nature, vol 502 49. Jacobs et al (1992) Melting Of Ice Shelves And The Mass Balance Of Antarctica, Journal Of Glaciology, Vol. 38 50. Holland et al (2012) Wind-Driven Trends In Antarctic Sea-Ice Drift. Nature Geoscience 51. Dinniman, (2012) Sensitivity Of Circumpolar Deep Water Transport And Ice Shelf Basal Melt Along The West Antarctic Peninsula To Changes In The Winds. Journal Of Climate Volume 25 52. Nakayama, et al (2013) From circumpolar deep water to the glacial melt water plume on the eastern Amundsen shelf, Deep-Sea Research, vol 77, p.50–62 53. Box, J. et al (2009) Greenland Ice Sheet Surface Air Temperature Variability: 1840–2007. Journal of Climate, vol. 22. 54. Menary, M. and Scaife, A. (2014) Naturally forced multidecadal variability of the Atlantic meridional overturning circulation. Climate Dynamics, vol. 42, p.1347–1362. 55. Dylmer,C. et al (2013) Northward advection of Atlantic water in the eastern Nordic Seas over the last 3000 yr. Clim. Past, vol. 9, p. 1505–1518 56. Wanamaker, A. et al (2012) Surface changes in the north Atlantic meridional overturning circulation during the last millennium. Nature Communications, vol. 3. 57. Koshkarova, V. and Koshkarov , A. (2004) Regional Signatures Of Changing Landscape And Climate Of Northern Central Siberia In The Holocene. Russian Geology Geologiya and Geophysics i Geofizika Vol. 45, No. 6, pp. 717-729. 58. Kaufman, D. et al (2004) Holocene thermal maximum in the western Arctic (0–180_W). Quaternary Science Reviews, vol. 23, p.529–560. 59. Drinkwater, K. (2006) The regime shift of the 1920s and 1930s in the North Atlantic. Progress in Oceanography vol. 68, p.134–151 60. Gillett et al (2008), Attribution Of Polar Warming To Human Influence. Nature Geoscience Vol 1. 61. Zeeberg, J. and Forman, S. (2001) Changes in glacier extent on north Novaya Zemlya in the twentieth century. The Holocene, vol 11, p. 161-175
|
Heartland interview regards science of butterflies, coral, birds
Based on my writings on penguins I was honored by Australia’s Institute of Public Affairs to contribute a chapter on the current state of the Emperor Penguins in the IPA's new book Climate Change: The Facts 2020
https://climatechangethefacts.org.au/
Is there a Climate Crisis? My interview on "Ask John"
$1000 Student Climate Challenge Award
Clarifying Lies from Internet Snipers
Daily Kos Eschews Anthrax Basic Epidemiology, Embraces Climate Fear Mongering
Critical Thinking Questions
1. How do we determine if resent ice melt is any different from past natural melting?
2. Why are melting Antarctic glaciers happening in relatively small, restricted local regions?
3. Why were rates of glacier melt greater in the 1930s and 40s?
4. Why is Arctic sea ice melting but Antarctic sea ice expanding to record extents?


